Nature Runs
Runs in nature almost always make it harder for GPS trackers to work the right way. Endomondo (and my Galaxy Nexus) were certainly no different in our series of nature runs. We tested the app and our phone in a wooded area with no leaf canopy (since the run was taken in February) and found that the app worked sufficiently, but not nearly as accurately as it did when tested in a suburban environment. Our tests were demanding, containing tight cuts, relatively short loops, constant changes in elevation, and plenty of mature trees. Distances tracked were hard to compare since there was no published course distances to work with, but we felt they were good approximations for the short runs we did – possibly off by as much as 10%.
Endmondo worked well enough on wooded nature runs, but lacked accuracy.
Nature There And Back Run | Nature Loop Run
There and Back
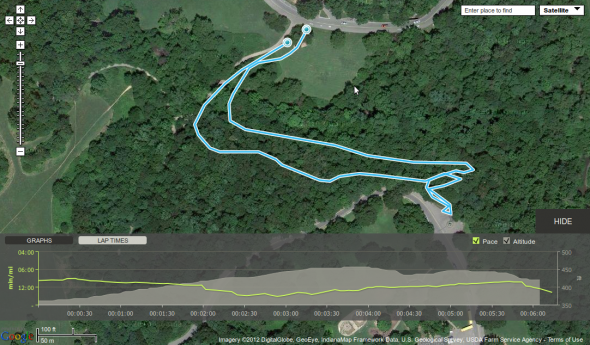
This run was taken on Feb 7 on a partly cloudy day. I used my Galaxy Nexus and my Scosche armband on this run. It took me through wooded area, over a river, and up a bank. Endomondo claimed I ran .52 miles on this 6:13 run. Since this was a there and back again run there is something a little strange about the path Endomondo tracked for the run. Unlike the suburban context where the tracking did a very accurate job pathing my route, in the wooded area the GPS faltered (even with no leaves on the trees). According to some measurements taken using the data it looks like the trails were off by as much as 30 m from each other. This almost certainly has more to do with the Galaxy Nexus than with the sports tracking app.
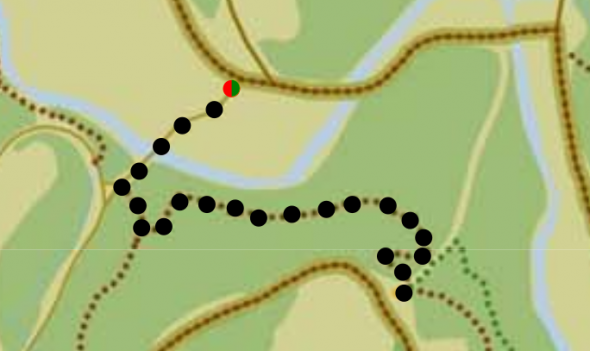
Below is a the trail as drawn by the people over at parks division in my city with my route highlighted:
When compared with my actual route the two look very similar. The route with the Endomondo is smoother than the one generated by the park agency. This is probably because Endomondo takes a sampling of points as recorded by my phone while the government agency used some other method to build the map. Either way, it it is close enough for me to suspect that for the distance that I traveled the measurement provided by Endmondo is pretty accurate, despite the very different paths mapped by this fitness GPS tracking app.
Endmondo also had trouble again determining my altitude changes. Despite starting and stopping at the same spot on the map the altitude change is registering as a massive 59 ft (361 ft to start, 420 ft to end). Since this was an uphill and then downhill run the app shows that my change is 95 ft from the beginning of the run to the highest point, while my change from the highest point of the run to the end point is just 36 ft. My guess is that neither of these is exactly accurate and that the truth is somewhere in between.
Loop Run
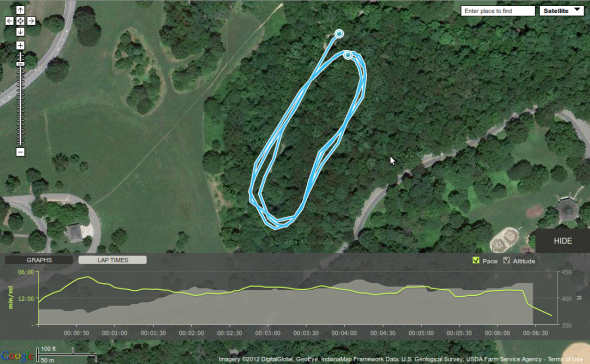
This run was taken on Feb 7 on the same partly cloudy day and in pretty much the same location as my there-and-back run outlined above. I still used my Galaxy Nexus and my Scosche armband. I ran the loop three times total for what Endomondo measured as a .69 mile trip, making each loop about .23 miles long.
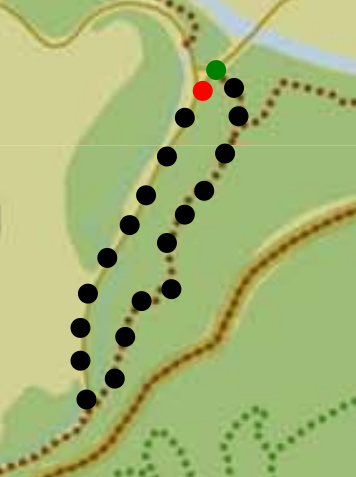
The image to the right represents what the track looked like from the government agency map. As with the other outdoor wilderness run it appears that Endomondo smoothed out the actual track I took when compared to the track generated by the parks department. The tracks appear close enough to each other to be a fair representation of the actual distance that I traveled while running. There are some places where the app appeared to have a harder time generating data, like on the bottom turn of the run. This also is the portion of the run that looks least like the map to the right, which has more of a pointed bottom. However, the actual run did not really come to a point like the map represents – suggesting that Endomondo probably did a little better job representing the actual course I took. In the end, it seems as though tree cover affected Endomondo’s ability to get my position exactly but it still got pretty close.
If you have been reading the whole review to this point you know that altitude data has been wacky. This run was no different. I started and ended this run at pretty much the same location yet the altitude change between my starting and ending location was 50 feet (377 ft to begin, 427 ft to end). That is an error of at least 25 ft for one of those measurements anyway you slice it. I still don’t think this is a huge deal, but it could be for some people.
Review Home | Track Tests | Suburban Tests | Nature Tests | Indoor Tests | How To Use


